Market Depth Gives Stock Traders the Edge
Empowered by innovative heatmap technology, dxFeed Bookmap provides full transparency and revolutionary insight into the order book and trades for all US equities. This product allows traders to track individual market makers, and explore with unlimited resolution chart data that is usually invisible in other charts. To understand how dxFeed Bookmap gives traders the edge, we need to look at examples of information that can be obtained via traditional candlesticks charts, and compared them to dxFeed Bookmap for the same period.
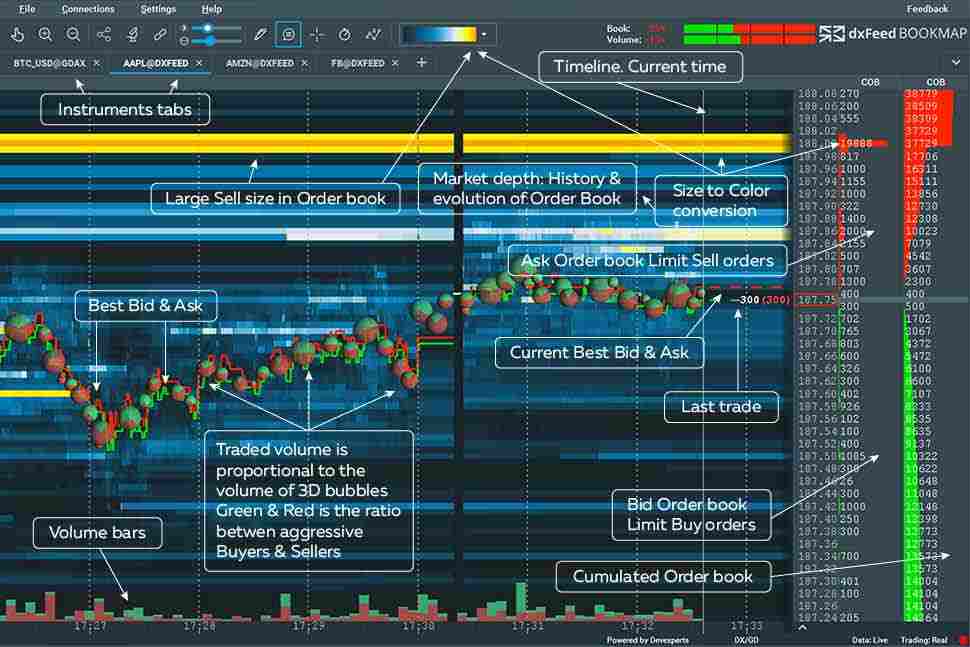
Instead of traditional candlestick charts, Bookmap technology displays unfiltered Best Bid/Ask lines, Volume Bubbles, Limit Order Book as heatmap, and much more. Together these features provide:
- maximum transparency of the market actions
- explanation of market actions
- ability to observe those actions in real-time, and thus predict their future impact on the market.
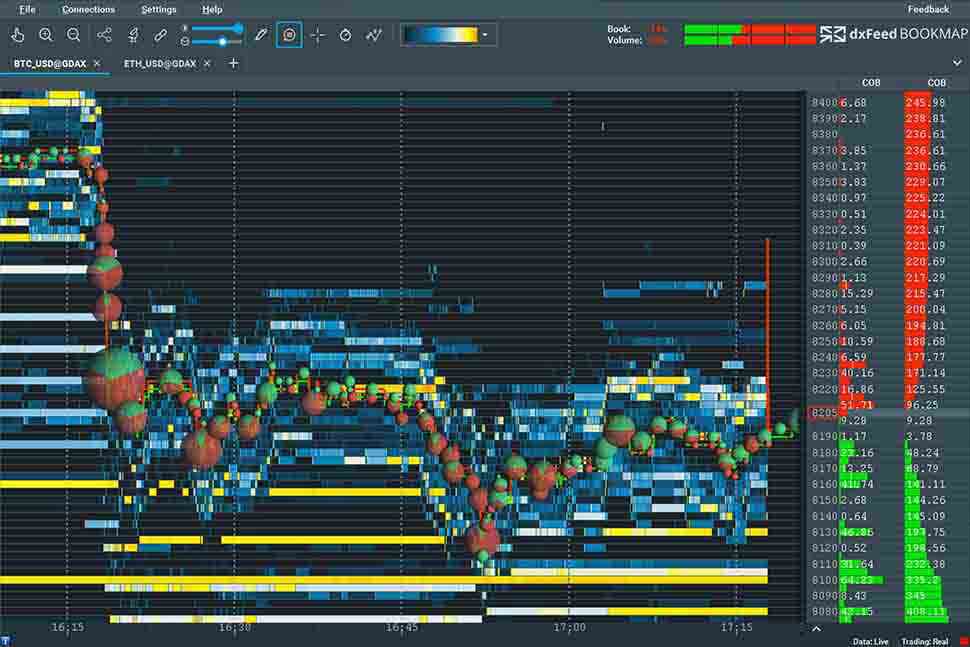
dxFeed Bookmap. It is clear that dxFeed Bookmap offers an increased level of market details and transparency.
dxFeed Bookmap addresses the needs of professional traders who are looking to monitor liquidity on the market. Advancing beyond simply displaying the number of aggressive buyers and sellers or showing the last price as a line, dxFeed Bookmap overlays a heatmap on top of ordinary charts which show the complete history of the Order Book (aka DOM: Depth of Market). This equips traders with the knowledge of evolution of the entire order book over time, and thus the true intentions of other market participants. It offers a significant advantage when comparing it to other charts that show only a snapshot of the DOM.
.
dxFeed Bookmap provides traders with a clear overview of the entire volume being traded, as well as the total size of limit orders at each price level. All market events are stored, enabling the user to view the market in the most detailed way (up to nanoseconds). By default the dxFeed Bookmap chart updates at a rate of 40 frames-per-second, displaying the market like a high definition video in real-time with a very low CPU consumption of typically just 1-3% per chart. This has become possible only recently thanks to advancements in video-card GPU technology.
dxFeed Bookmap presents 100% of the market data in different ways
Best Bid and Offer lines represent the highest buyers (green), and the lowest sellers (red). This helps to identify exactly what was the spread and how it changed over time.
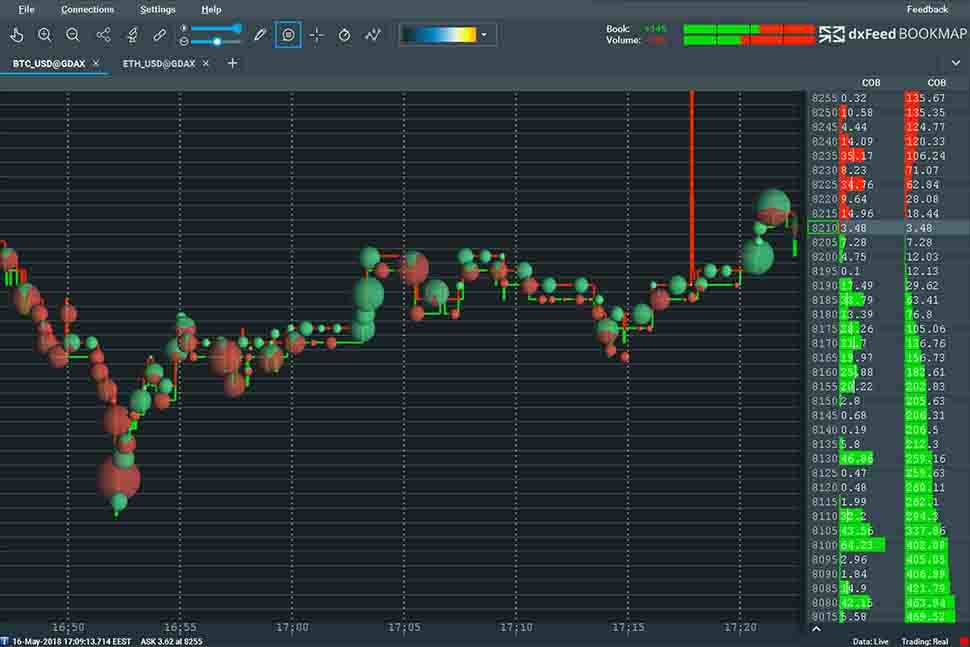
dxFeed Bookmap also offers a more detailed view of candlestick bars, showing the VWAP of buyers and sellers separately or in total. The candlesticks and volume bars represent an aggregated view of trades over time.
Another way to look at the volume traded is Volume Bubbles. dxFeed Bookmap offers several ways of clustering the volume including non-aggregated, aggregated by time or by volume methods, and it also offers a proprietary clustering algorithm. The colors of the pie-chart dots represent the proportion of buyers and sellers, the center of a dot represents the VWAP and TWAP of its volume, and the area of the dot is the total volume traded. It can be scaled to a millisecond.
However, even non-aggregated volume typically represents ~5% of the market data. The order book displayed by heatmap completes the picture by revealing 100% of the markets data, which in many cases can explain why the trades occurred as they did. This is because many traders are using order book information for making trading decisions, which in turn invites more sophisticated algorithmic traders and transforming this action-reaction process into a game.
dxFeed Bookmap has developed an innovative way of viewing the information that is not available in other trading platforms. The evolution of the entire order book in real-time displayed in heatmap (Bookmap = Order Book + Heat Map) is in the core of Bookmap. In a sense, it visualizes additional 3rd dimension of the data on a 2-dimensional chart.
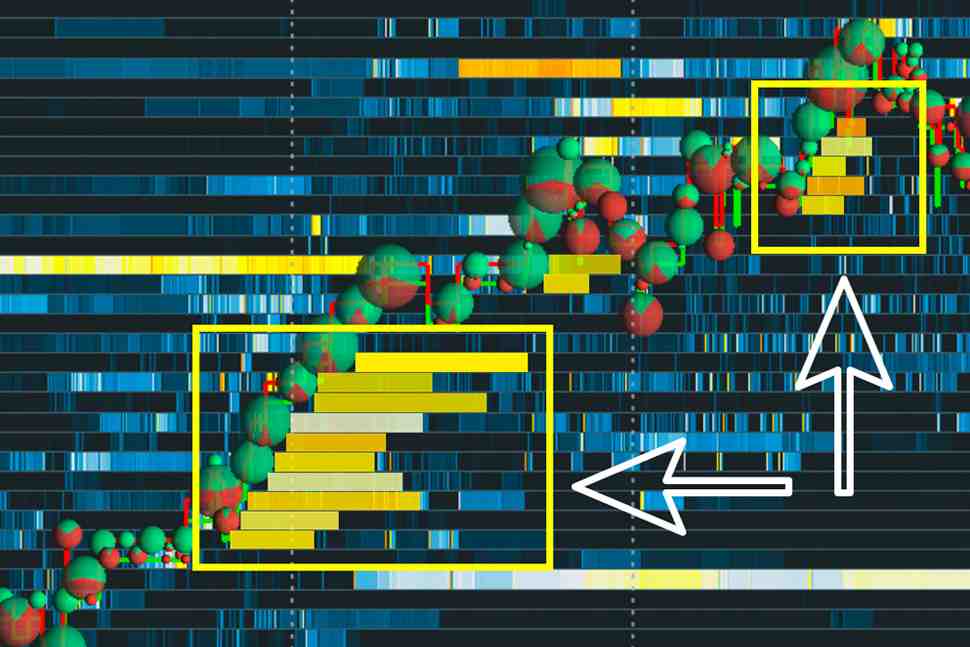
Pushing the boundaries of financial data analysis dxFeed Bookmap has numerous indicators and add-ons, such as the option to look for hidden orders or icebergs. It’s possible to track the history of a particular market maker or large trader, that trades in a particular direction using an execution algorithm. This data can be used to anticipate how they will affect the market.
In the example below, a large trader sets significant amounts of buy orders near the best ask price, causing the price to move up. As we can see in the high resolution snapshot, the trader randomly varies the sizes of orders, their prices, and their timing, to be undetected by other algorithmic traders. But this activity is easily spotted with a single glance at dxFeed Bookmap chart.
dxFeed Bookmap provides full market transparency empowering traders with the ability to study the historical behaviour of other traders and market makers, and to observe their current actions in real-time.
dxFeed Bookmap offers traders and brokers the latest tools that enable them to stay one step ahead in the highly competitive markets. It provides Nasdaq Total View, CTA, and BATS EDGX market depth data, which cost thousands of dollars and was only available to institutional traders. Now every trader can afford it.
dxFeed Bookmap runs free educational webinars about using Market Depth data in stock trading on Thursdays. The next webinar is on May 17, 2018, at 1:00PM EST.
Start Trading with Free $30 : CLAIM NOW $30
VERIFY YOUR ACCOUNT AND GET YOUR $30 INSTANTLY ,MAKE MONEY WITHDRAW !!
IF YOU FACE ANY PROBLEM TO GET THIS OFFER PLEASE CONTACT US FOR
SUPPORT , CLICK SMS BAR ABOVE THEN TALK TO USE


Comments
Post a Comment